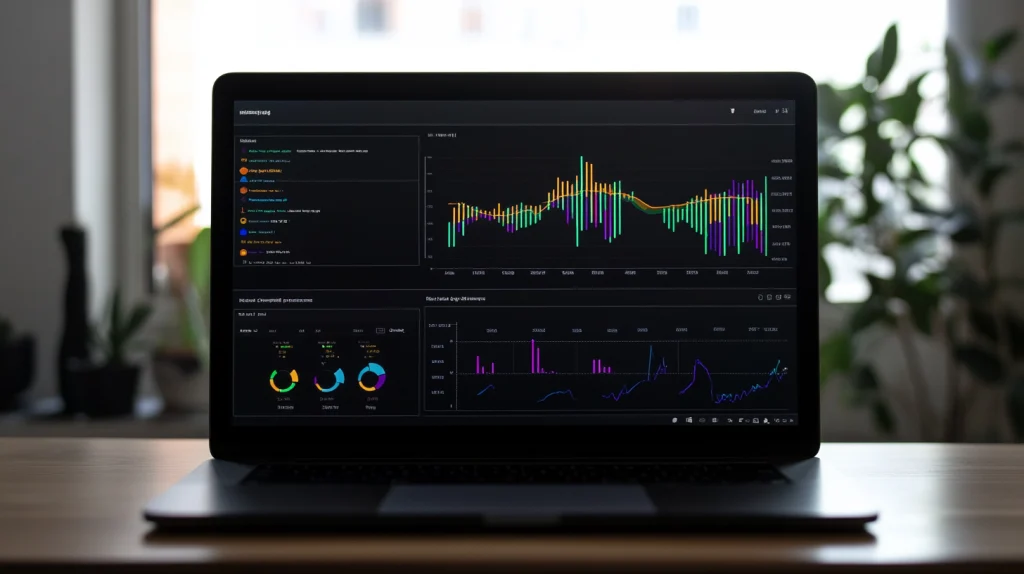
Modern IT infrastructures need reliable and flexible monitoring. Errors, overloads, failures — all this can be predicted and prevented with the help of competent monitoring. Three popular tools — Zabbix, Prometheus and Grafana — have become the standard in system administration. Let’s figure out what to choose and for what tasks.
1. Zabbix: all-in-one for traditional servers
Zabbix is a full-fledged monitoring system with centralized management, agents and a powerful notification system. Well suited for data centers, physical and virtual servers.
Advantages:
- Monitoring “out of the box” (CPU, RAM, network, disk, etc.).
- Visualization directly in the system.
- Rich system of triggers and alerts.
- Convenient web interface.
2. Prometheus: DevOps Focus and Metrics for Everything
Prometheus is a project from the Cloud Native Computing Foundation. It integrates perfectly with Kubernetes and microservice architecture. It collects time series of metrics, not just current values.
Advantages:
- Suitable for dynamic infrastructure.
- PromQL query language for advanced analysis.
- Pushgateway for non-standard scenarios.
- Perfectly combined with Grafana.
3. Grafana: metrics visualization at its best
Grafana is not a monitoring tool as such, but a visualization interface that connects to various data sources: Prometheus, Zabbix, Elasticsearch, InfluxDB and others.
Benefits:
- Beautiful and customizable dashboards.
- Notifications based on conditions and graphs.
- Support for multiple sources.
- Integrations with Teams, Slack, Telegram and more.

| Characteristic | Zabbix | Prometheus | Grafana |
|---|---|---|---|
| Type | Monitoring+UI | Collection of metrics | Visualization |
| Agent support | ✅ Yes | ⚠️ Not necessary | ❌ No |
| Real-time metrics | ✅ Yes | ✅ Yes | ✅ Via source |
| Data warehouse | Built-in | TSDB (time-series) | ❌ No, only UI |
| Query language | Simple trigger | PromQL | SQL-like (in UI) |
| Kubernetes integration | ⚠️ Limited | ✅ Complete | ✅ Complete |
| Difficulty of setup | 🟡 Average | 🔴 High | 🟢 Simple |
Which tool to choose?
- If you have a classic infrastructure and need agents, choose Zabbix.
- If you have microservices, Docker and Kubernetes, Prometheus + Grafana is a better choice.
- If you just want to add visualization to existing monitoring, feel free to use Grafana as a dashboard solution.
The choice between Zabbix, Prometheus and Grafana depends on your tasks. Ideally, you should combine the tools: Prometheus as a collector, Grafana as a visualizer, and Zabbix as an alert system.

Leave a Reply